Building an AI Trading Bot — Week One: Why a 90 % Win Rate Can Still Lose Money

📊 Full opportunity report: Building an AI Trading Bot — Week One: Why a 90 % Win Rate Can Still Lose Money on ThorstenMeyerAI.com — validation score, market gap, and execution plan.

TL;DR

An experimental AI trading bot achieved over 90% win rates in simulated markets, but detailed analysis reveals that high win rates alone do not ensure profitability. The key is the risk-reward profile of trades.

Initial testing of an AI-driven trading bot in simulated crypto markets shows that strategies with over 90% win rates can still lose money. This finding challenges common assumptions about high win rates indicating profitability and highlights the importance of risk-reward dynamics.

The researcher has run 21 strategy variants in parallel, each on simulated data involving short-dated binary prediction markets for major cryptocurrencies. Among these, some variants displayed win rates exceeding 90%, with two reaching 100% over 38–44 trades. However, further analysis revealed that these high win rates were achieved by taking late, heavily favored trades, which are not indicative of genuine edge.

When adjusting for market-implied probabilities—rather than naive 50% assumptions—the apparent edge disappeared. Many strategies with high win rates actually had negative expected value due to the asymmetry of payoffs; small wins were offset by disproportionately large losses when bets were wrong. Conversely, a single strategy with a below-50% win rate showed consistent profitability because its average winning trades were significantly larger than its losses, demonstrating that true edge depends on risk-reward balance, not frequency of wins.

Interestingly, the same model applied to different assets yielded inconsistent results—profitable on one, losing on others—suggesting that any strategy’s success is highly dependent on specific market microstructure and volatility regimes. The researcher emphasizes that these early findings are preliminary and that more extensive testing is needed before drawing firm conclusions about any strategy’s viability.

Building an AI Trading Bot · Week One · The Win Rate Trap.
DISPATCH / PAPER TRADING RESEARCH AI TRADING BOT · WEEK ONE · WIN RATE TRAP · SIMULATED FUNDS
▲ NOT FINANCIAL ADVICE Paper trading · simulated funds only · research lab
Building an AI Trading Bot · Part 1 of an ongoing series

Week one.
Why a 90% win rate
can still lose money.

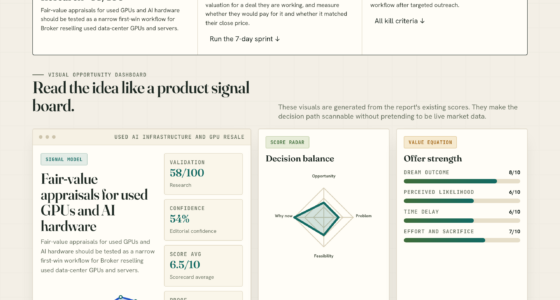
21 strategies running in parallel · 700+ settled paper trades · 18 of 21 with reasonable win rates · 2 variants at 100% wins. And almost none of it means what it looks like.

An experimental AI-driven trading bot running 21 strategy variants against 5-minute binary prediction markets on major crypto assets. Every trade is paper — simulated funds only. Headline numbers look extraordinary: 18 of 21 variants with reasonable win rates · entire fleet on one underlying with >90% wins · two specific variants at 100% wins over 38-44 settled trades. The data is telling a very different story than the leaderboard suggests. Most of the "winning" strategies are buying when the market has already priced one side at 90-95 cents on the dollar — the right baseline isn't 50%, it's the market-implied probability, and below 95% wins on that math is a slow bleed. One strategy — and only one — has the opposite signature: below-50% win rate, 2.5× average winning trade vs losing trade, meaningfully positive net P&L over several hundred settled positions. The right signature. The smoking-gun negative result: same code running on different assets is statistically significantly losing money. Same model, same parameters, different markets, different results — that's data you'd pay for.

!
▲ Not financial advice · simulated funds only · research lab
The bot described here trades exclusively with simulated money. Nothing in this article should be used to inform real trading decisions. If you build something similar and run it with real funds, you should fully expect to lose them — that is the most likely outcome, by a wide margin, regardless of what early numbers suggest. Prediction markets are zero-sum after fees, dominated by sophisticated participants, and structurally hostile to part-time retail strategies.
▲ The structural editorial finding · week one
Win rate is the wrong metric. P&L distribution and expected value are everything. A 95%-win strategy that loses 19× as much when it's wrong is a worse trade than a 45%-win strategy that pays 2× as much when it's right. The right null hypothesis is not "random" — it's "whatever the market is already pricing." A strategy that works equally well on everything is almost always a fluke; a strategy that works narrowly is doing something.
— building an ai trading bot · week one · the win rate trap · paper trading research lab
21
Strategy variants running in parallel · 4 strategy families × 4 underlyings · each on its own simulated bankroll
Real market data · real order books · real fees · real latency model · simulated funds only · research lab not wallet
700+
Settled paper trades across the fleet · enough to reject "obviously useless" · nowhere near enough to claim "real edge"
18 of 21 variants showing reasonable win rates · entire fleet on one underlying at >90% wins · 2 at 100% over 38-44 trades
1
Strategy with the right edge signature · <50% win rate · 2.5× win:loss ratio · meaningfully positive net P&L
Fair-value style model on most liquid underlying · candidate worth watching · sample still too small to call
99%
Confidence on cross-asset negative result · same code statistically significantly losing money on other underlyings
Same model · same parameters · same code path · different volatility regime + microstructure · different result · informative
90% WIN RATE TRAP SNIPER-STYLE VARIANTS · 19× LOSSES VS WINS · NET NEGATIVE P&L · MECHANICAL ILLUSION BASELINE IS NOT 50% MARKET-IMPLIED PROBABILITY IS THE RIGHT NULL · 95% PRICED IN = 95% NEEDED TO BREAK EVEN CANDIDATE SIGNATURE <50% WINS · 2.5× WIN:LOSS · MEANINGFULLY POSITIVE · ORDER OF MAGNITUDE MORE TRADES NEEDED CROSS-ASSET NEGATIVE SAME CODE, DIFFERENT MARKETS, DIFFERENT RESULTS · 99% CONFIDENCE NEGATIVE-EDGE ON ONE VARIANT RUN-TO-ZERO DRAWDOWN GATES DISABLED AS TEACHING EXERCISE · $300 BANKROLL EVAPORATED · INFORMATIVELY MOST STRATEGIES ARE FLAT-TO-LOSING · 1 OF 21 WORTH MORE INVESTIGATION · REST ARE ILLUSIONS, LOSERS, OR NOISE
The 90% win rate trap · asymmetric P&L · the math

90% wins. Still net negative.

Most of the "winning" strategies in the fleet are buying when the market has already decided one side is going to win. They wait until one outcome is priced around 90-95 cents on the dollar, then take the favorite. If the favorite holds, the trade pays a few cents. If it doesn't, the trade loses almost the entire bet. The asymmetry makes the high win rate structurally meaningless.

The asymmetric-P&L math · 90% wins ≠ profit
The 10 winning trades pay a few cents each. The 1 losing trade loses almost the entire bet. The right question is not "do you win more than half the time?" — it's "do you win at the rate the market is already pricing in?"
▲ Sniper-style variant · 90% wins
Mechanical illusion
10 trades × +$0.05 = +$0.50 won
1 trade × −$0.95 = −$0.95 lost
−$0.45 net11 trades · 90.9% win rate · negative P&L
▲ Candidate signature · <50% wins
Real edge
4 trades × +$2.50 = +$10.00 won
6 trades × −$1.00 = −$6.00 lost
+$4.00 net10 trades · 40% win rate · positive P&L
▲ The right baseline · market-implied probability, not coin-flip
If the market is pricing the favorite at 95% to win, you need to win at least 95% of those trades just to break even after the asymmetric payoff. Anything less than 95% is a slow bleed, regardless of how confident the percentages look. A high win rate, by itself, tells you almost nothing about whether a strategy has edge — it tells you about the kind of trades being taken, not the quality of the decisions.
The candidate signature · what real edge looks like
Use Claude to Build 7 AI Trading Bots: Stocks, Options, Crypto. The Multi-Strategy Playbook used for Backtesting and Live Trading (AI Trading Bot Series)

Use Claude to Build 7 AI Trading Bots: Stocks, Options, Crypto. The Multi-Strategy Playbook used for Backtesting and Live Trading (AI Trading Bot Series)

As an affiliate, we earn on qualifying purchases.

As an affiliate, we earn on qualifying purchases.

One candidate. Right signature.

After dismissing the high-win-rate experiments as mechanical illusions, the search shifted to the opposite signature — a strategy that loses more often than it wins but still makes money. That's the mathematical fingerprint of a real prediction signal: bigger wins than losses, willing to be wrong frequently in service of being right with conviction.

The candidate signature · <50% wins, 2.5× win:loss, net positive
Fair-value style model on the most liquid underlying. One strategy in the fleet — and currently only one — looks like a real edge signature. Sample still too small to call. Running for at least an order of magnitude more trades before claiming more than "candidate worth watching."
▲ Win rate
<50%
Wrong more often than right. Willing to lose frequently in service of being right with conviction — the mathematical fingerprint of real edge.
▲ Win:loss ratio
2.5×
Average winning trade is roughly 2.5× average losing trade. Asymmetric P&L on the right side — bigger wins than losses produces positive expected value at <50% accuracy.
▲ Net P&L
+
Meaningfully positive over several hundred settled positions. Fair-value style model not momentum/favorite-rider · most liquid underlying · the right edge signature.
▲ The caveat · sample still too small to call
A few hundred settled trades is enough to reject "obviously useless" — it is nowhere near enough to confidently claim "this is real edge that will persist." A favorable variance window of the right length can produce numbers that look exactly like this without any underlying skill at all. Running for at least an order of magnitude more trades before claiming more than "this is the candidate worth watching."
Cross-asset negative result · the smoking gun
How to Use AI for Stock Trading: Master the Secret Strategies of AI in Stock Trading: Discover Hidden Tools, Advanced Techniques, and Proven Methods ... Markets and Boost Your Trading Success!

How to Use AI for Stock Trading: Master the Secret Strategies of AI in Stock Trading: Discover Hidden Tools, Advanced Techniques, and Proven Methods ... Markets and Boost Your Trading Success!

As an affiliate, we earn on qualifying purchases.

As an affiliate, we earn on qualifying purchases.

Same code. Different markets.

The strongest evidence that the candidate strategy might be real comes from an unexpected place: running the exact same code on different assets produces statistically significant losses. Same model, same parameters, same code path, different volatility regime, different microstructure, different result.

Cross-asset negative result · same model, different outcomes
A strategy that works equally well on everything is almost always a fluke. A strategy that works on one specific market structure and fails on others is doing something. The cross-asset variants ran themselves down toward zero, generating clean evidence the underlying model is not universal.
▲ Underlying 1
Most liquid
+ Positive
Meaningfully positive net P&L. Candidate signature. <50% wins · 2.5× win:loss · several hundred trades.
▲ Underlying 2
Cross-asset
− Negative
Statistically significantly losing. Same model · same parameters · different volatility regime.
▲ Underlying 3
Cross-asset
− Negative
99% confidence negative-edge. Same code path · different microstructure · ran itself down toward zero.
▲ Underlying 4
Cross-asset
− Negative
Bankroll evaporated. Risk gates disabled as teaching exercise · $300 simulated bankroll · informatively.
▲ The structural finding · informative in a way "everything's green" never is
The cross-asset variants ran themselves down toward zero, generating clean evidence the underlying model is not universal — that's data you'd pay for. Instead it came from a $300 simulated bankroll evaporating in an interesting way. The negative result is the structural evidence that the candidate strategy might be doing something real — narrow applicability is a feature, not a bug.
Week one lessons · plain language · five bullets
Python for Algorithmic Trading Cookbook: Recipes for designing, building, and deploying algorithmic trading strategies with Python

Python for Algorithmic Trading Cookbook: Recipes for designing, building, and deploying algorithmic trading strategies with Python

As an affiliate, we earn on qualifying purchases.

As an affiliate, we earn on qualifying purchases.

Five lessons. Plain language.

What week one actually taught. The lessons are not novel to anyone who has spent serious time on systematic trading — but you don't internalize them until you watch them happen on your own paper bankroll. Out of 21 variants, one candidate worth more investigation. The ratio is roughly what was expected going in.

Five lessons crystallized · the week one observation set
Most strategies will be flat-to-losing. 1 of 21 candidate worth more investigation · the rest are either mechanical illusions, statistically-confirmed losers, or too noisy to tell apart from random. That ratio is roughly what was expected going in.
01
Win rate is the wrong metric. P&L distribution and expected value are everything. A 95%-win strategy that loses 19× as much when it's wrong is a worse trade than a 45%-win strategy that pays 2× as much when it's right.
02
The right null hypothesis is not "random." It's "whatever the market is already pricing." If your strategy isn't beating that, you don't have an edge — you have a confusing way to copy the consensus.
03
Run the same strategy on multiple markets before believing it works. If it falls apart when you change the underlying, it might be real and narrowly applicable. If it works on everything, it's almost certainly variance.
04
Disable risk gates only as a teaching exercise. Several experiments hit their drawdown limits, gates were loosened, they tripped again, gates were disabled entirely, they ran to zero. That run-to-zero was extremely informative. Doing the same thing with real money would have been a disaster.
05
Most strategies will be flat-to-losing. Out of 21 variants, 1 candidate worth more investigation. The rest are illusions, statistically-confirmed losers, or too noisy to tell apart from random. That ratio is roughly what was expected going in — but you don't internalize it until you watch it happen.

Win rate lies. Sample sizes lie. Most things that look like alpha are not. A high win rate, by itself, tells you almost nothing about whether a strategy has edge — it tells you about the kind of trades being taken, not the quality of the decisions. One strategy in the fleet has the right signature — <50% wins, 2.5× win:loss, meaningfully positive net P&L on the most liquid underlying. That's the candidate worth watching. Same code on different markets produces statistically significant losses — informative in a way "everything's green" never is. If you take this article as a reason to put money into anything, you have misread it.

— building an ai trading bot · week one · paper trading research · part 1 of an ongoing series · simulated funds only
The research lab · what's being measured
  • Underlying markets · 5-minute "Up or Down" binary prediction markets on major crypto assets
  • Strategy fleet · 21 variants in parallel · 4 strategy families × 4 underlyings
  • Bankroll model · each variant on its own simulated bankroll · isolated from the rest
  • Simulation fidelity · real market data · real order books · real fees · real latency model · simulated funds only
  • Sample size · 700+ settled trades across the fleet as of week one
  • Headline trap · 18 of 21 showing reasonable win rates · entire fleet on one underlying at >90% · 2 at 100% over 38-44 trades
  • Honest read · most of the "high win rate" variants are below the market's own implied 95% rate · slow bleed
  • Aggregate 16 sniper variants · net negative P&L despite 90% wins · 10% of losses are 19× the size of the wins
  • Candidate signature · <50% wins · 2.5× win:loss · positive net P&L · most liquid underlying · fair-value style
  • Sample caveat · several hundred trades enough to reject "useless" · nowhere near "real edge that will persist"
  • Cross-asset finding · same code statistically significantly losing on other underlyings · 99% confidence on one variant
  • Smoking-gun negative · strategy that works equally on everything = fluke · works narrowly = doing something
  • Run-to-zero · risk gates disabled as teaching exercise · $300 simulated bankroll evaporated · informative
  • Lesson 1 · win rate is the wrong metric · P&L distribution and expected value are everything
  • Lesson 2 · right null hypothesis is market-implied probability · not coin-flip
  • Lesson 3 · run same strategy on multiple markets before believing it works
  • Lesson 4 · disable risk gates only as teaching exercise · never with real money
  • Lesson 5 · most strategies will be flat-to-losing · 1 of 21 candidate worth more investigation
  • What's next · week 2 longer-horizon results on candidate · 100% win rate trap deep-dive · cross-asset and cross-regime analysis · replay testing
  • Trade secrets · cookbook stays out · findings come out · broadcasting the recipe would make whatever edge exists evaporate the moment anyone copied it
Colophon · AI trading bot series · Part 1 · week one

Set in Source Serif 4 (display), EB Garamond (essay body), IBM Plex Sans & IBM Plex Mono. AI Trading Bot research lab · Part 1 of an ongoing series · paper trading only · simulated funds only · the win-rate trap and what real edge actually looks like. Empirical-clay dominant register · labor-rose for the cautionary findings (trap, run-to-zero) · alternative-sage for the candidate-strategy positive signal · structural-slate for the statistical-rigor cross-asset negative result · transition-bronze for the week-one lessons forward horizon. Free to embed with attribution.

thorstenmeyerai.com

AI Trading Bot · Week 1 · The Win Rate Trap · paper trading research

21 STRATEGIES · 700+ TRADES · 1 CANDIDATE · 4 ASSETS · 5 LESSONS · NOT FINANCIAL ADVICE

The New Trading for a Living: Psychology, Discipline, Trading Tools and Systems, Risk Control, Trade Management (Wiley Trading)

The New Trading for a Living: Psychology, Discipline, Trading Tools and Systems, Risk Control, Trade Management (Wiley Trading)

As an affiliate, we earn on qualifying purchases.

As an affiliate, we earn on qualifying purchases.

Implications for Evaluating Trading Strategies

This analysis underscores that a high win rate alone is insufficient for assessing a trading strategy’s value. Many strategies can appear successful due to the timing of trades or market conditions, without offering genuine predictive advantage. Investors and developers should focus on the risk-reward profile and expected value, rather than just frequency of wins, to identify strategies with real edge. The findings also highlight the danger of overfitting to specific assets or market regimes, as a model that works well in one context may fail elsewhere.

Limitations of Early Strategy Testing Results

The testing is based on simulated trades in short-dated binary markets for cryptocurrencies, using a variety of strategies designed to predict short-term price movements. The experiment aims to identify whether any approach can produce consistent profits before deploying real funds. Previous research in algorithmic trading has shown that high win rates often mask underlying risk, and this project confirms that pattern in a new context. The researcher has cautioned that the current sample size—several hundred trades—is too small to confirm a sustainable edge, and results may vary with more data or different market conditions.

"A high win rate, by itself, tells you almost nothing about whether a strategy has edge. It’s about the risk-reward profile, not just how often you win."

— Thorsten Meyer

Unresolved Questions About Strategy Durability

It remains unclear whether the strategies showing early signs of profitability will sustain their performance over a larger number of trades or in live trading conditions. The small sample size and simulated environment limit the ability to draw definitive conclusions. Additionally, the reasons why certain models fail or succeed across different assets are not fully understood and require further investigation.

Next Steps for Validating AI Trading Strategies

The researcher plans to extend the testing to at least ten times the current number of trades, across more assets and market conditions. This will help determine whether any strategies can generate consistent, positive expected value in live trading. Further analysis will also explore the specific features and parameters that contribute to genuine edge, while maintaining confidentiality to prevent strategy copying. Results from these extended tests are expected within the next few months.

Key Questions

Why do high win rates not guarantee profits in trading?

High win rates can be achieved by taking late, heavily favored trades that have small payoffs and large potential losses. True profitability depends on the risk-reward profile—winning more than you lose over time—not just how often you win.

What does the researcher mean by 'edge'?

Edge refers to a strategy with a positive expected value, meaning it earns more on average from winning trades than it loses on losing trades, considering the size of wins and losses.

Can strategies with low win rates still be profitable?

Yes. Strategies that accept frequent losses but have disproportionately larger wins can be profitable if the average winning trade outweighs the average losing trade, as demonstrated by the one promising model in the experiment.

Are the current results applicable to real trading?

No. These are simulated trades in a research environment. Real markets involve additional factors, including slippage, execution risk, and changing microstructure, which can affect performance.

What should traders and developers take away from this study?

Focus on the risk-reward profile and expected value of trades rather than just win rates. Be cautious of strategies that only appear successful due to specific timing or market conditions.

Source: ThorstenMeyerAI.com

You May Also Like

The queue. Why the grid, not the chip, is the binding constraint on AI.

The US interconnection queue now delays AI infrastructure buildouts, shifting the constraint from silicon to grid access, with significant economic and political implications.

Every Benchmark Launched 2023-2024 Has Fallen — The METR / SWE-Bench / CORE-Bench / MLE-Bench / PostTrainBench Sequence

Every major AI research benchmark launched between 2023 and 2024 has now saturated or is nearing saturation, signaling accelerated AI capability development.

Why AI-Ready Desktop Workstations Matter for Smaller Teams

Offering powerful, customizable hardware, AI-ready desktop workstations enable smaller teams to handle demanding workloads—discover why they are essential for your team’s success.

Fair-value appraisals for used GPUs and AI hardware

A new manual valuation approach for used GPUs and AI hardware aims to establish transparent fair-market prices, aiding resellers and buyers.