To guarantee your Kubernetes clusters run smoothly, you need a solid observability strategy that combines metrics, logs, and tracing. Metrics give you real-time performance indicators like CPU, memory, and network usage. Logs provide detailed event data for troubleshooting, while tracing visualizes request flows to identify delays and dependencies. Together, these tools give you a complete view of your environment, helping you prevent issues and optimize performance—if you want to explore how to implement them effectively, keep going.
Key Takeaways
- Observability integrates metrics, logs, and tracing to provide a comprehensive view of Kubernetes cluster health and performance.
- Metrics monitor real-time system indicators like CPU, memory, and network usage for early anomaly detection.
- Logs record detailed events and errors, aiding troubleshooting and event correlation within the cluster.
- Tracing visualizes request flows across microservices, identifying latency issues and dependency bottlenecks.
- Combining all three enhances proactive monitoring, improves troubleshooting efficiency, and maintains cluster stability.

As Kubernetes continues to dominate container orchestration, ensuring your clusters run smoothly becomes increasingly vital. You need a clear picture of what’s happening inside your environment to troubleshoot issues quickly, optimize performance, and prevent outages. This is where observability comes into play, offering you insights through metrics, logs, and tracing. These three pillars work together to give you a holistic view of your cluster’s health and behavior.
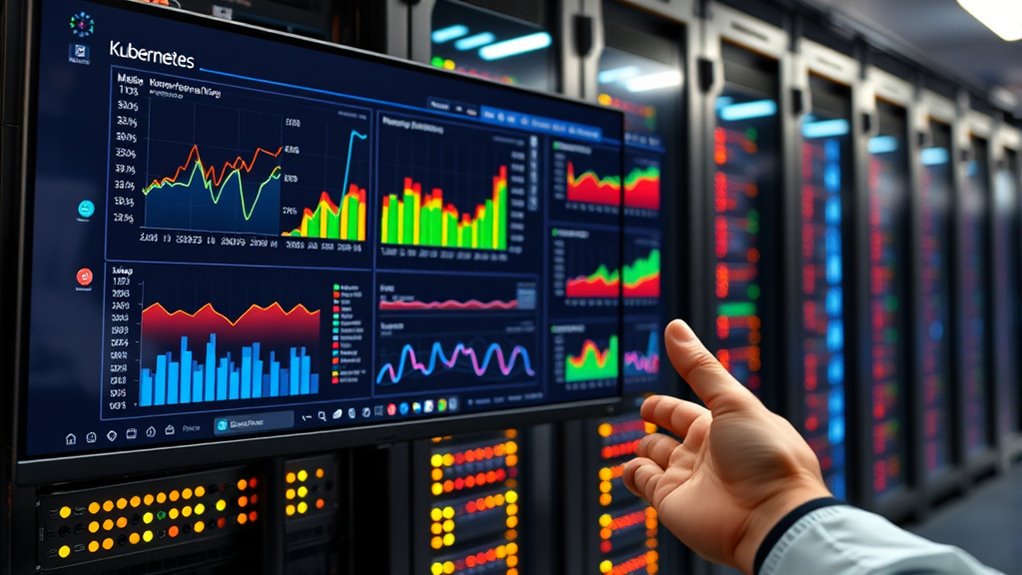
Metrics serve as your real-time indicators of system performance. They measure key aspects like CPU usage, memory consumption, network traffic, and pod status. By collecting and analyzing these numbers, you can easily spot anomalies or resource bottlenecks before they escalate into serious problems. For example, a sudden spike in CPU utilization might signal a runaway process or a misconfigured deployment. Setting up dashboards to visualize metrics helps you monitor your cluster continuously and react swiftly. Prometheus is a popular tool for collecting and querying metrics, integrating seamlessly with Kubernetes. With it, you can create alerts that notify you of critical thresholds, ensuring you stay ahead of potential issues.
Metrics provide real-time insights into CPU, memory, and network, helping you detect issues early and maintain cluster health.
Logs offer a detailed record of what’s happening inside your containers and nodes. They capture events, errors, and informational messages, providing context that metrics alone can’t deliver. When a pod crashes or a deployment fails, logs are your first stop to understand why. You can stream logs in real-time or search through historical data to identify patterns or recurring problems. Tools like Fluentd or Logstash help aggregate logs from multiple sources, making it easier to analyze large volumes of data. Centralized log management enables you to troubleshoot faster, correlate events across different components, and maintain compliance with audit requirements. Additionally, understanding monitoring best practices can improve your ability to interpret log data effectively.
Tracing takes observability even further by revealing how requests flow through your system. When a user interacts with your application, tracing shows the path that request takes across microservices, databases, and external APIs. This visibility helps you identify latency bottlenecks, pinpoint failures, and optimize the overall user experience. Distributed tracing tools like Jaeger or Zipkin integrate with Kubernetes, capturing trace data automatically. By analyzing traces, you can see exactly where delays occur and understand dependencies between different services. This insight is vital for diagnosing complex issues and improving system performance.
Together, metrics, logs, and tracing form a detailed observability strategy for Kubernetes. They empower you to monitor proactively, troubleshoot efficiently, and optimize your clusters for stability and performance. Embracing these pillars ensures you have the right tools and information at your fingertips to keep your Kubernetes environment running smoothly and reliably.
Top picks for "observability kubernet metric"
Open Amazon search results for this keyword.
As an affiliate, we earn on qualifying purchases.
Frequently Asked Questions
How Does Observability Impact Kubernetes Security?
Observability greatly enhances your Kubernetes security by providing real-time insights into system behavior. When you monitor metrics, logs, and traces, you can quickly identify suspicious activities, misconfigurations, or vulnerabilities. This proactive approach helps you detect and respond to threats faster, prevent potential breaches, and ensure compliance. Ultimately, observability empowers you to maintain a secure, resilient environment, minimizing downtime and protecting your infrastructure from malicious attacks.
What Are the Best Tools for Kubernetes Observability?
You should use tools like Prometheus for metrics, which offers real-time insights into your cluster’s performance. Combine it with Grafana for visualization, making data easy to interpret. For logs, Elasticsearch, Fluentd, and Kibana (EFK stack) enable efficient log collection and analysis. For tracing, consider Jaeger or Zipkin, which help diagnose issues across microservices. These tools together give you all-encompassing observability, enhancing your Kubernetes environment’s reliability and security.
How to Optimize Resource Usage for Observability Tools?
You can optimize resource usage for observability tools by carefully selecting lightweight solutions that fit your needs, avoiding over-provisioning, and configuring sampling rates to reduce data volume. Use resource limits and requests in your deployment manifests, prune unnecessary metrics, and utilize auto-scaling to adjust resource allocation dynamically. Regularly monitor the tool’s performance, and leverage centralized storage to minimize overhead, ensuring your observability stack remains efficient without straining your infrastructure.
Can Observability Be Automated in Kubernetes Environments?
Think of automating observability like having a smart thermostat that adjusts itself. Yes, you can automate it in Kubernetes environments. Tools like Prometheus, Grafana, and Jaeger can automatically collect, analyze, and alert you on issues without manual intervention. You set the rules once, and they continuously adapt, helping you catch problems early—saving time and preventing outages, just like a thermostat keeps your home comfy without constant adjustments.
How Does Observability Integrate With Ci/Cd Pipelines?
You integrate observability into your CI/CD pipelines by automating metrics collection, log analysis, and tracing at each deployment stage. This allows you to guarantee application health, detect issues early, and ensure quality. You can embed tools like Prometheus, Grafana, or Jaeger into your pipelines, triggering alerts or rollbacks if anomalies appear. This proactive approach helps maintain reliability and performance throughout your development lifecycle.
Conclusion
By implementing thorough observability with metrics, logs, and tracing, you can dramatically improve your Kubernetes cluster’s reliability and performance. Did you know that organizations using advanced observability tools see up to 60% faster incident resolution? Embracing these practices not only helps you catch issues early but also boosts your confidence in managing complex environments. So, start integrating observability today and experience smoother, more resilient Kubernetes operations.


