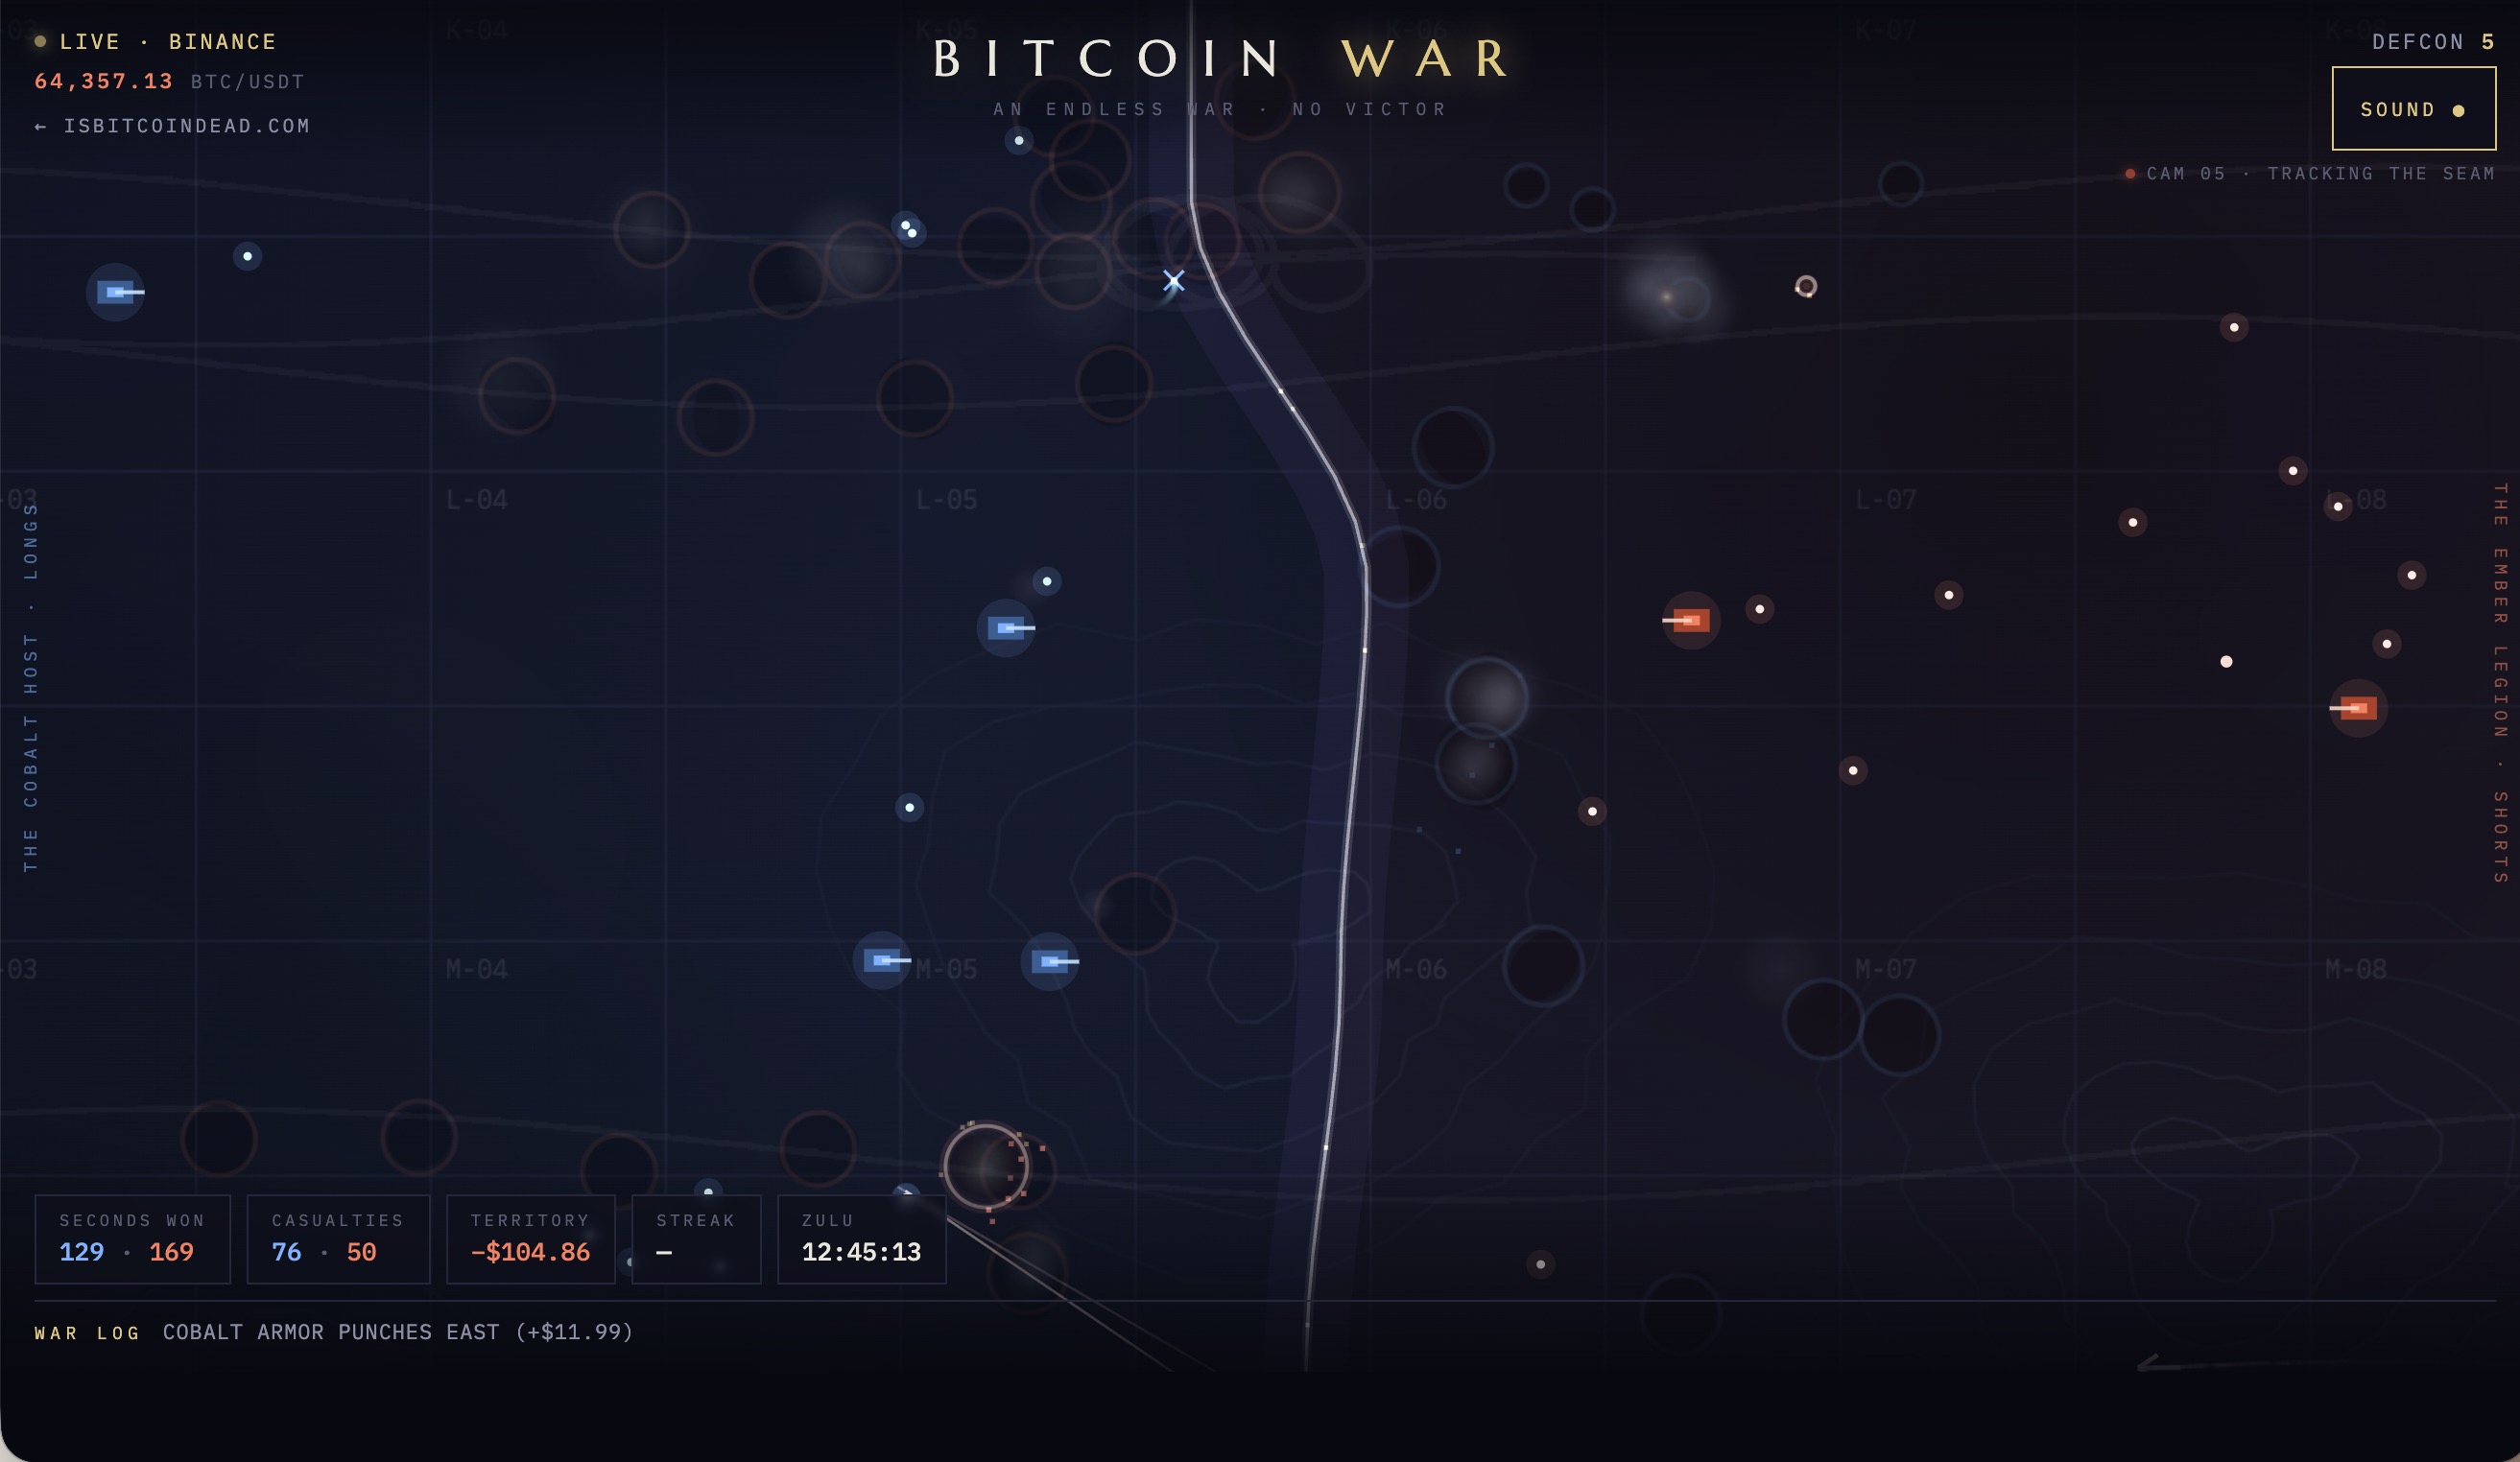

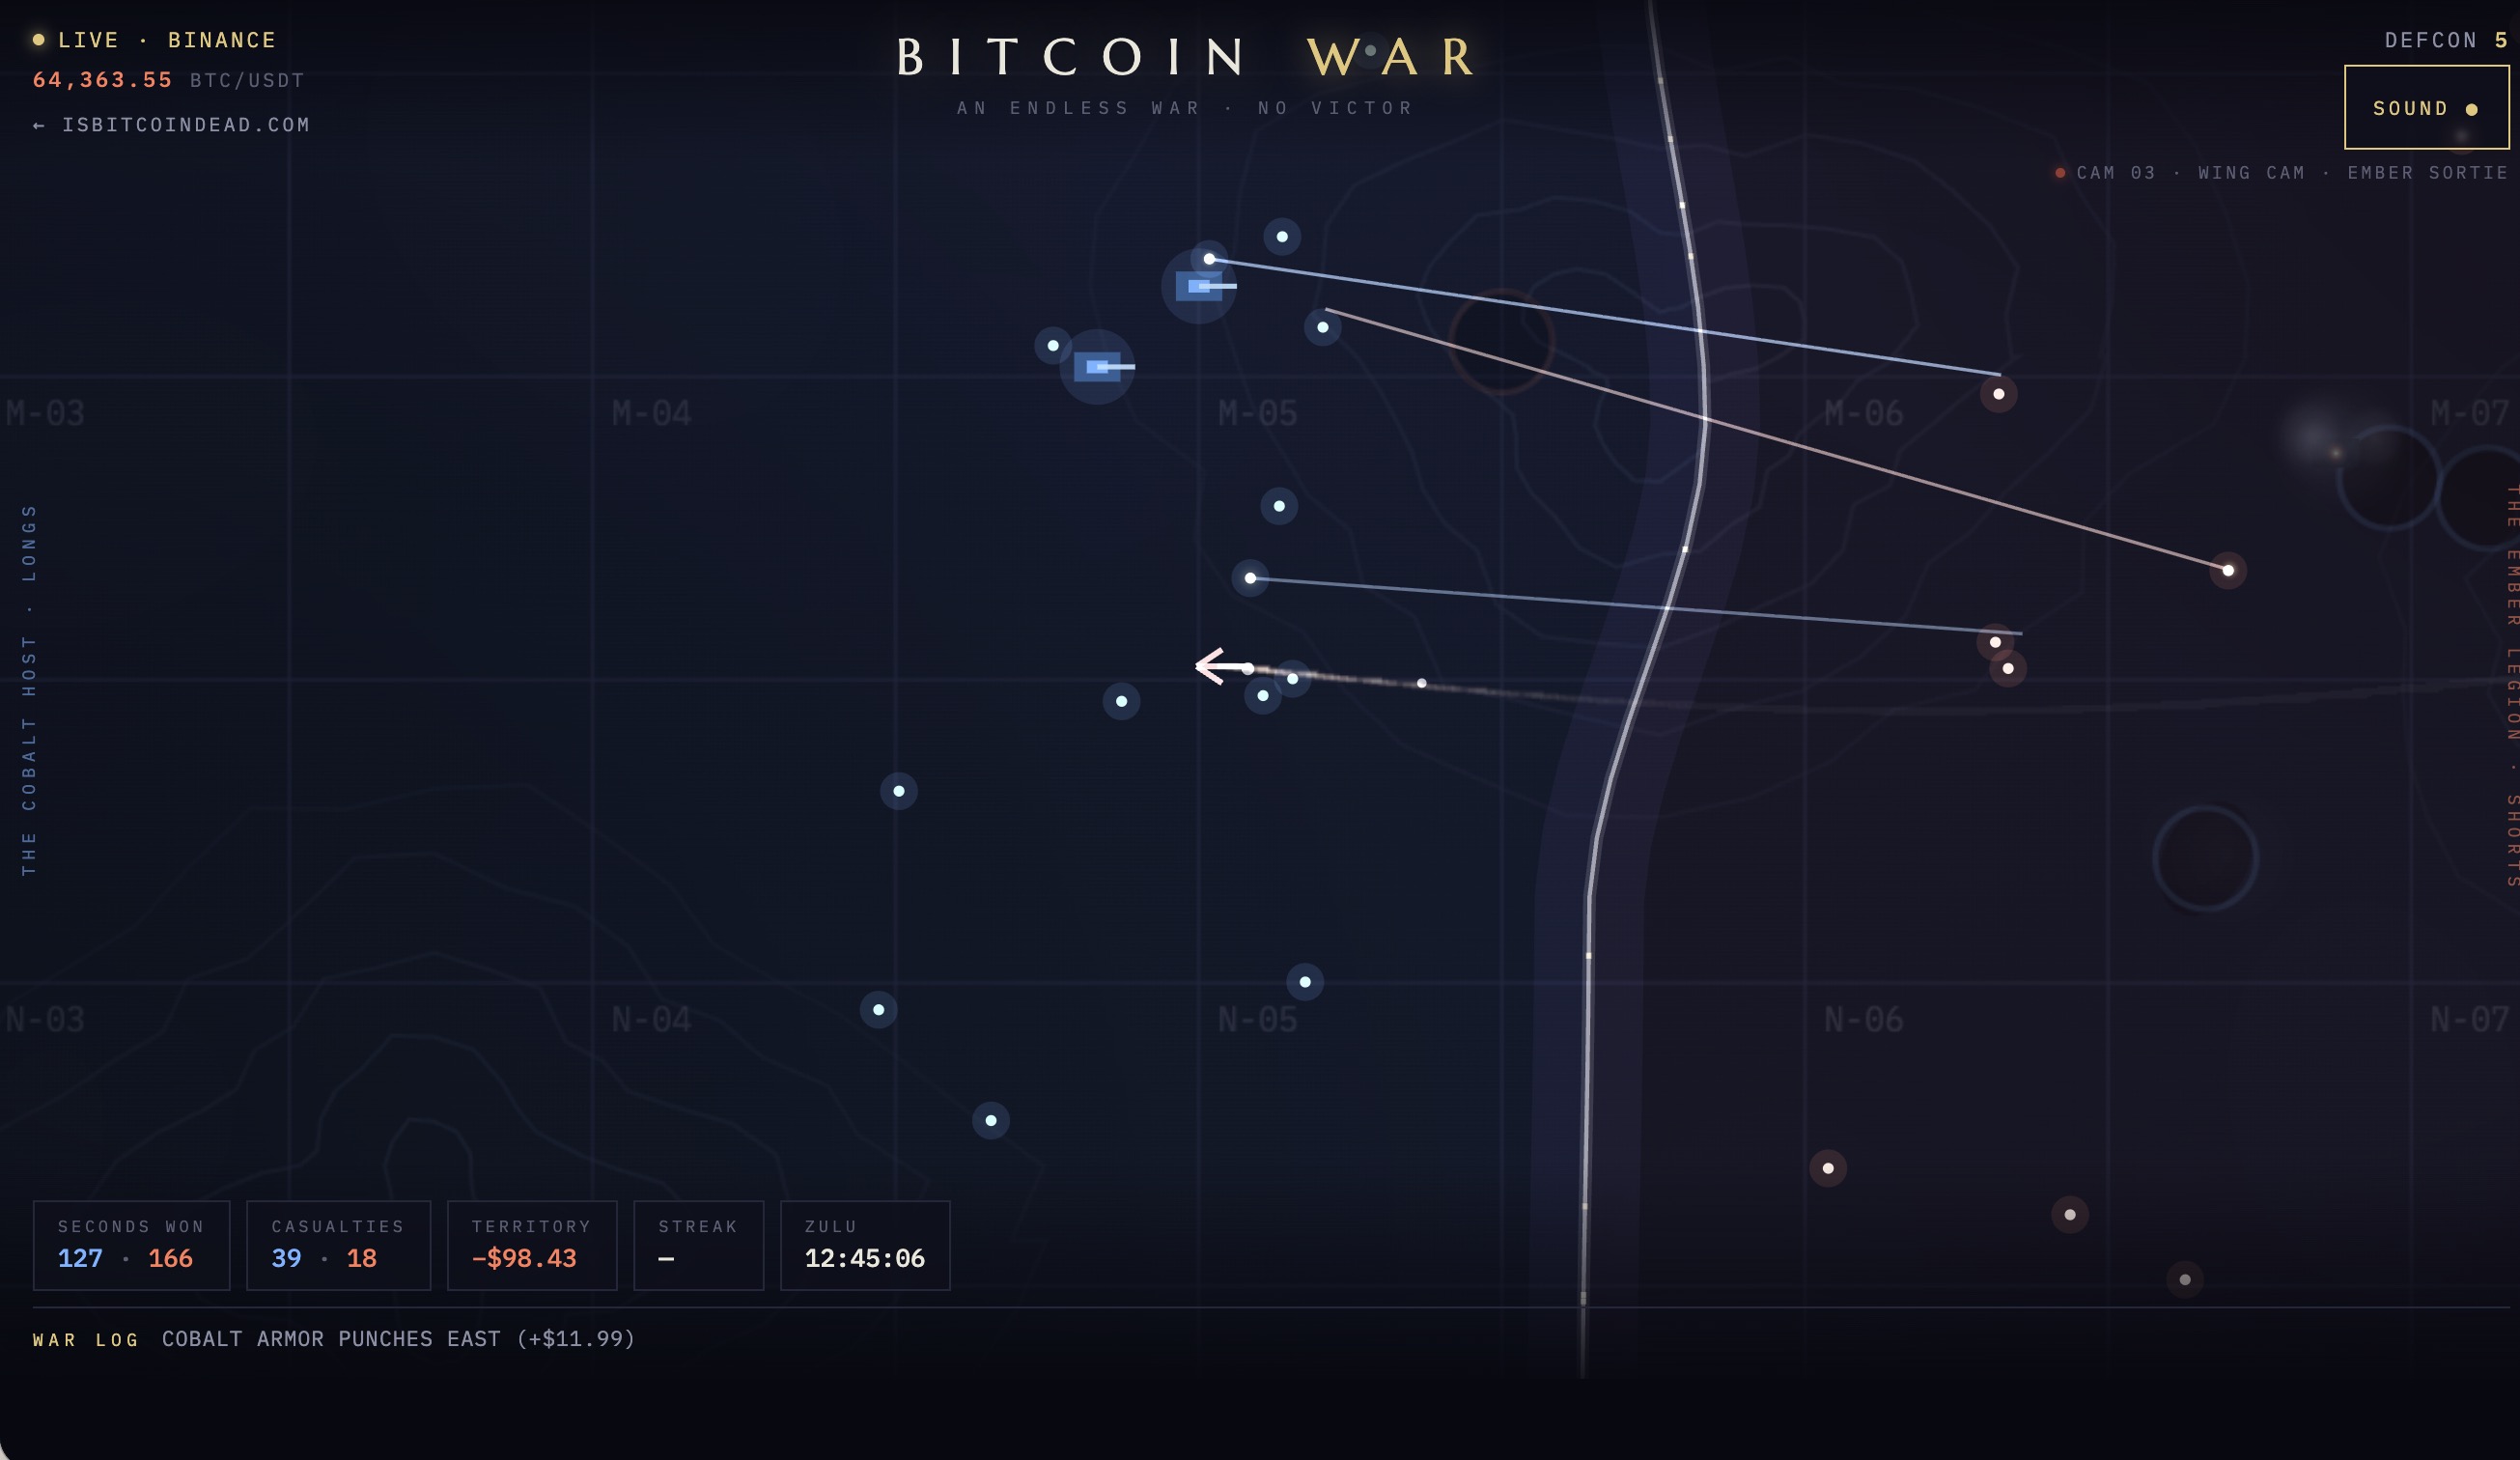
Experience the Bitcoin War, a groundbreaking live visualization from isbitcoindead.com, that transforms the BTC/USDT tape into an endless cinematic battlefield. This innovative display turns real-time trade data into a vivid war zone, where two armies—The Cobalt Host and The Ember Legion—clash along the front line, representing the current Bitcoin price. The scene is dynamic, with no ultimate victor, only ongoing combat.
The system connects directly from your browser to the public Binance trade stream, with an automatic fallback to Coinbase, ensuring continuous updates. Every tick becomes a move in the battlefield: buyers push the line from the left, while sellers push back from the right. Large liquidations serve as airstrikes, adding to the chaos. The entire visualization is crafted using pure browser technology, leveraging Canvas 2D, WebAudio synthesis, and raw WebSocket streams to keep it lightweight (~180KB total) and serverless.

An automatic camera system shifts between wide shots and close skirmishes, capturing the intensity of the battle in real-time. The DEFCON meter provides live volatility readings, while a scrolling war log narrates each move. An in-browser synthetic soundtrack intensifies with the order flow, creating a visceral experience without any external audio files. The interface also features a scoreboard that counts seconds won, casualties, and territory in dollars, emphasizing the ongoing war over Bitcoin’s price.
It’s important to note that Bitcoin War is not a trading platform. No wallets, no signals, no advice—just an artistic and engineering marvel that offers a live reading of the BTC/USDT tape. Designed to run seamlessly in any modern browser, it’s a showcase of web-native tech, making it accessible for tech enthusiasts interested in browser-based visualization and real-time data streaming.
If you’re curious about the tech behind this visual spectacle, explore more at isbitcoindead.com. Be sure to watch the war unfold live and experience the raw battle for Bitcoin’s price in a whole new way.

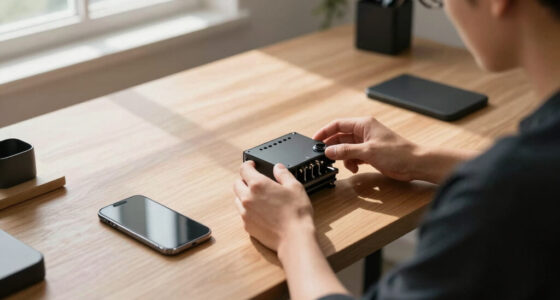
CryptoTicr Bitcoin Ticker – Real-Time Crypto Price Display (1.54" Diagonal) for Top 1,000 Coins Like Bitcoin, Ethereum, Dogecoin, and 997 more. Compact Size, Ideal for Desk or Nightstand. Uses Wi-Fi.
- Creator Support: USA-based support with 2-year warranty
- Real-Time Prices: Displays live prices for top 1,000 coins
- Compact Design: Small size ideal for desk or nightstand
As an affiliate, we earn on qualifying purchases.
As an affiliate, we earn on qualifying purchases.
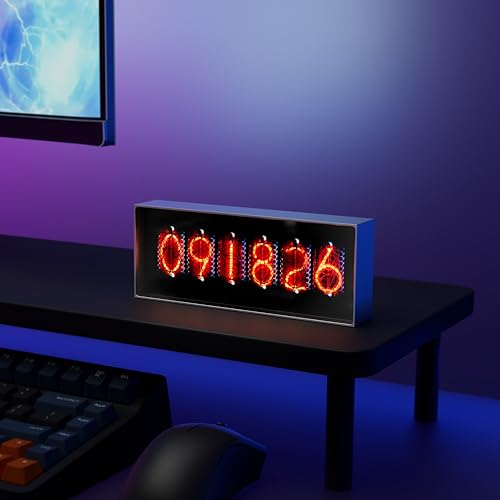
Electronic Display for Real-Time Cryptocurrency/Bitcoin/Stock Market Data, Time, Weather & Temperature, 164*28*65mm, Supports Image Upload and 30s Video Playback, App-Controlled, 960*360 Resolution
- Real-Time Data Display: Cryptocurrency, stock, time, weather updates
- Custom Media Uploads: Upload images and 30s videos
- App-Controlled Management: Control content and display modes
As an affiliate, we earn on qualifying purchases.
As an affiliate, we earn on qualifying purchases.

Python real-time data visualization tricks – How to combine WebSockets and Bokeh to visualize dynamic data streams – (Japanese Edition)
As an affiliate, we earn on qualifying purchases.
As an affiliate, we earn on qualifying purchases.
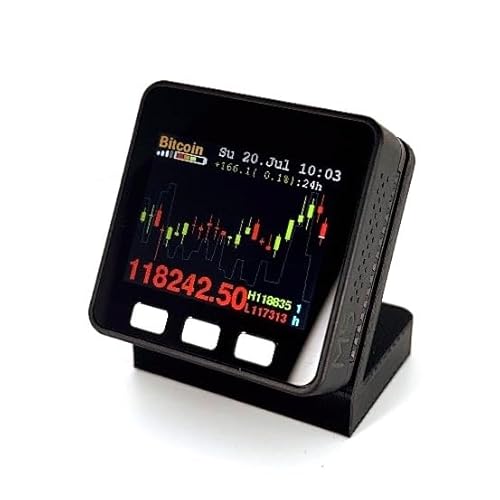
Crypto Gift Price Display – Real-Time Desktop Stock & Crypto Candlestick Charts – Live Market Data Ticker – Customizable – Multiple Finishes & Battery Options – Track SPY TSLA BTC ETH Doge
- Market Display: Real-time stock and crypto charts
- Customizable LCD: Adjust timeframes, language, and brightness
- Asset Monitoring: Track up to 25 assets with instant updates
As an affiliate, we earn on qualifying purchases.
As an affiliate, we earn on qualifying purchases.